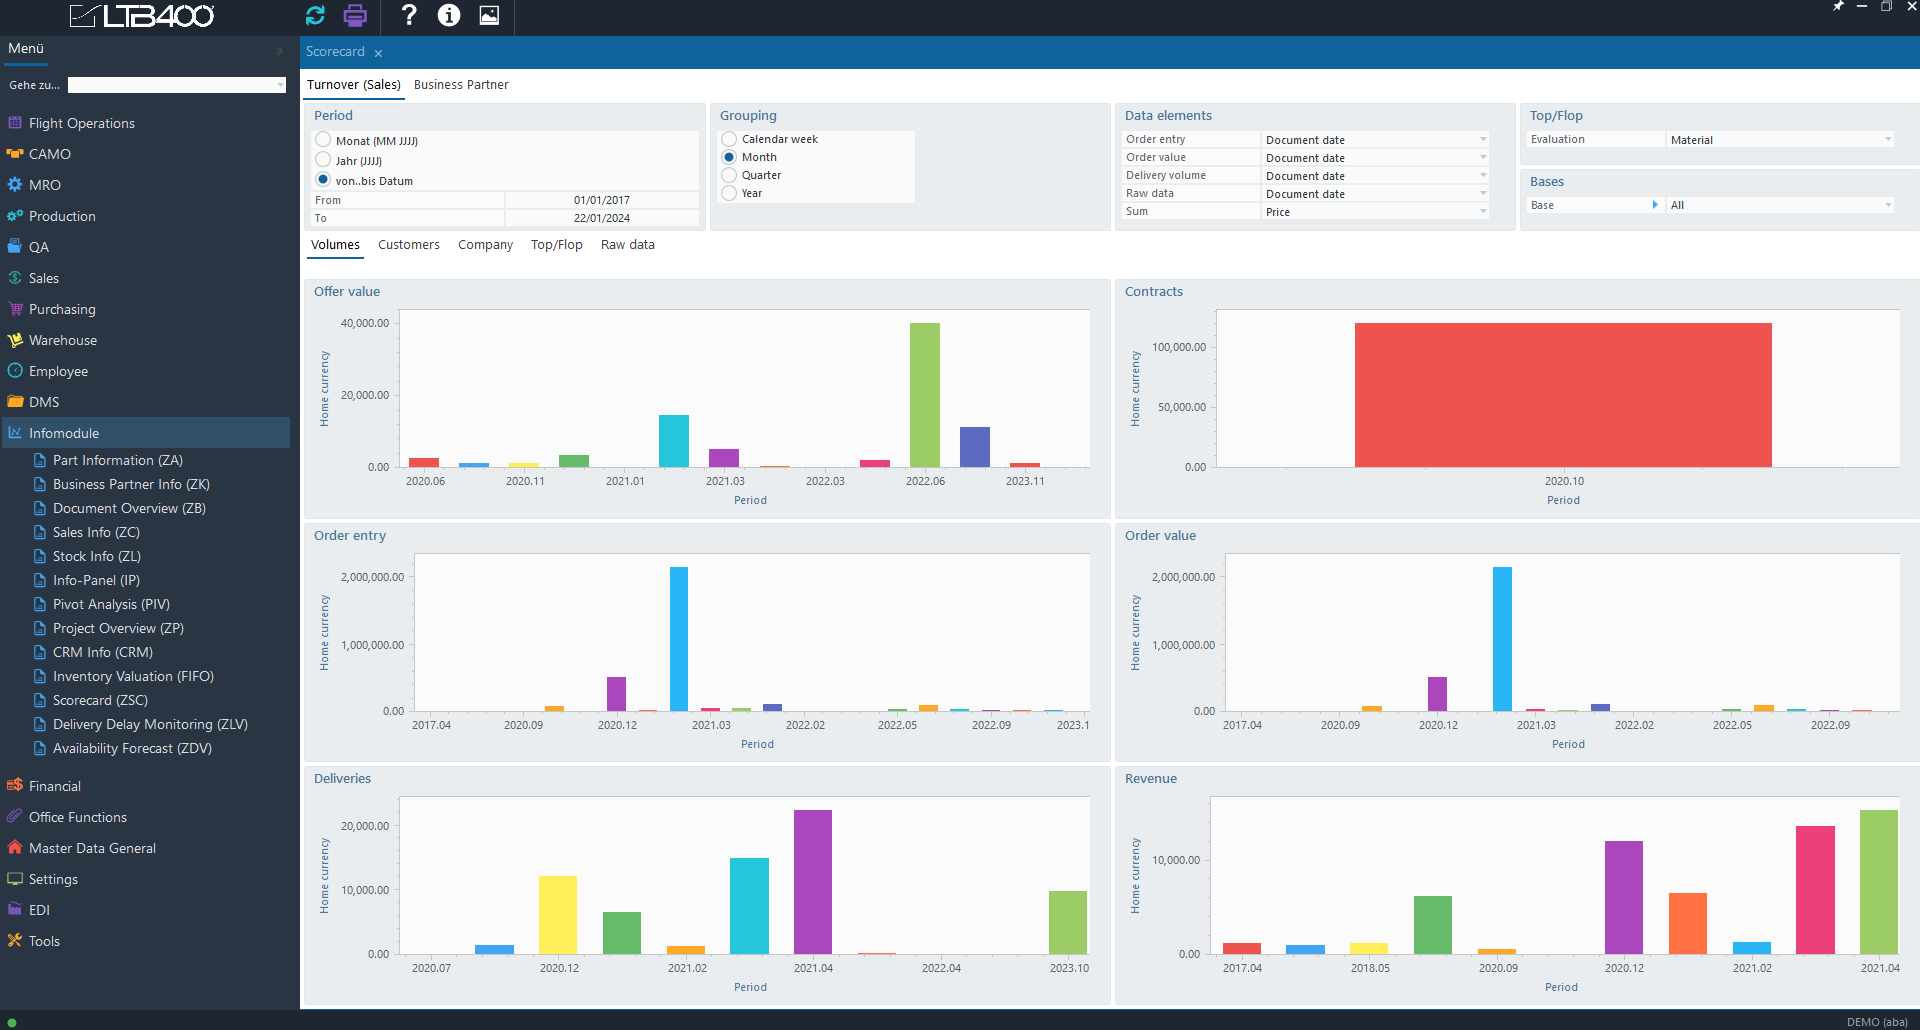
The Balanced Scorecard shows you all the relevant key figures at a glance. You decide what you want to see as you can configure the structure of the module yourself. As a rule, no programming knowledge is required for this.
- Free definition of company key figures via selection from standard key figures, SQL macro, or freely programmable hook function.
- Display as grid, value, bar chart, pie chart, speedometer.
- Target/actual comparisons (red-green deviation).
- Flexible periodization (day, week, month, year, financial year) of all values.
- Comparison of related values (e.g. sales for certain article groups in a grid).
- SQL Macro Designer.

